It is stationary when the variance and mean of the series are constant with time.
Here is a visual example:
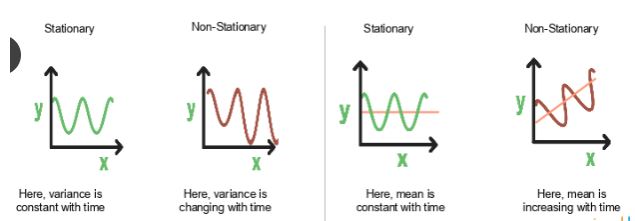
In the first graph, the variance is constant with time. Here, X is the time factor and Y is the variable. The value of Y goes through the same points all the time; in other words, it is stationary.
In the second graph, the waves get bigger, which means it is non-stationary and the variance is changing with time.