The major work of Tableau software is to connect and extract the data stored in various places. It can pull data from any platform. Tableau can extract data from any database, be it Excel, PDF, Oracle, or even Amazon Web Services.
Once Tableau is launched, ready data connectors are available which allow you to connect to any database.
The data extracted can be connected live to the Tableau data engine, Tableau Desktop. This is where a Data Analyst or a Data Engineer work with the data that was pulled up and develop visualization. The created dashboards are shared with users in the form of static files. The users receiving dashboards view the files using Tableau Reader.
The data extracted from Tableau Desktop can be published to Tableau Server, which is an enterprise platform where collaboration, distribution, governance, security model, and automation features are supported. Using Tableau Server, end users can access the files from all locations, be it a desktop or a mobile phone.
As it can be seen in the image below, Tableau Business Intelligence and Data Visualization tool has been placed in the Leader’s quadrant for seven consecutive years in the Business Intelligence and Analytics platforms by the IT research firm, Gartner.
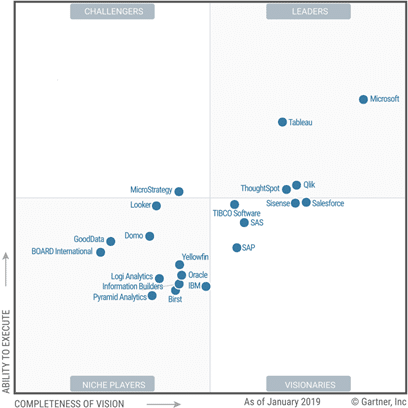
Gartner Magic Quadrant for Business Intelligence and Analytics Platforms
Following are the two ways in which Data Analytics of Tableau can be described:
- Developer Tools: Tools used in development, like designing of charts, dashboards, reports, and visualizations, come under this category. The major Tableau products in this category are Tableau Public and Tableau Desktop.
- Sharing Tools: By the name, you would have understood what these tools do. Well, they are used for sharing reports, visualizations, and dashboards which are created using the developer tools. Main products that fall in this category are Tableau Online, Tableau Reader, and Tableau Server.